
Note! This graph appears for Critical Path customers only.
The Historical Pace "waterfall" graph provides an insight as to how the location is progressing with the completion of tasks overall. It compares the percentage of tasks that should be remaining with the percentage of thats that are actually remaining (i.e. not complete).
Some goals of this graph are:
- Allows location leaders to anticipate if their team is completing tasks at a fast-enough pace to open the location on time. If the dark blue line is below the gray line, then the team has been working at or beating expectation. If the dark blue line is above the gray line, then the team is behind pace.
- Allows leader to visualize if there is going to be big change in the pace that tasks will have to be completed. For example, the first few months there is only a handful of tasks but as the opening date approaches there is a lot more tasks. The graph will start to "fall" faster indicating a larger percentage of tasks that will need to be completed each week.
- Provide the ability to see if there has been an extended period of time without status updates.
To create this graph we take a snapshot each week with the number of tasks that are completed, remaining, and the number of tasks that were expected to be completed. In addition, we calculate the number of tasks that should be completed in each of the upcoming eight weeks.
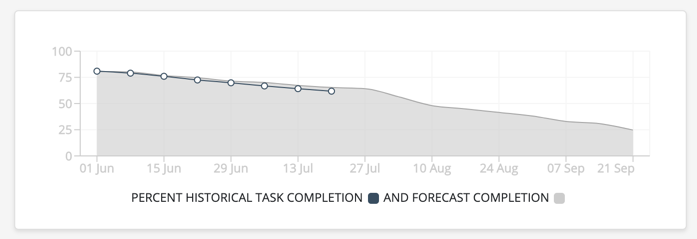
Example A
In the graph below, the dark blue line is below the gray line indicating that this location has been doing a great job in working ahead of pace for the past 8 weeks. There is a larger decrease in the gray line between 27-Jul and 10-Aug indicating there are more tasks to be completed in those weeks than in the previous weeks. The location will have to increase the number of tasks that are completed in the next two week to retain the same trajectory.
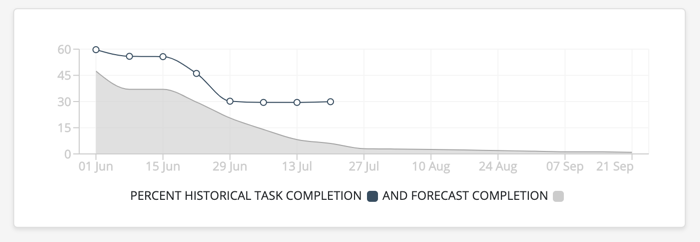
Example B
In the graph below, the dark blue line is above the gray line indicating that this location has not completed the number of tasks as expected. There may be many reasons for this including staffing issues or maybe the opening date has not yet been changed in the application. There was a large decrease in the gray line between 15-Jun and 29-Jun indicating the team was working hard to catch up. It appears no status updates have occurred in the app since the 29-Jun. The location will have to increase the number of tasks that are completed in the upcoming weeks to complete all tasks prior to the opening date.
Comments
0 comments
Article is closed for comments.